
 Español
 English
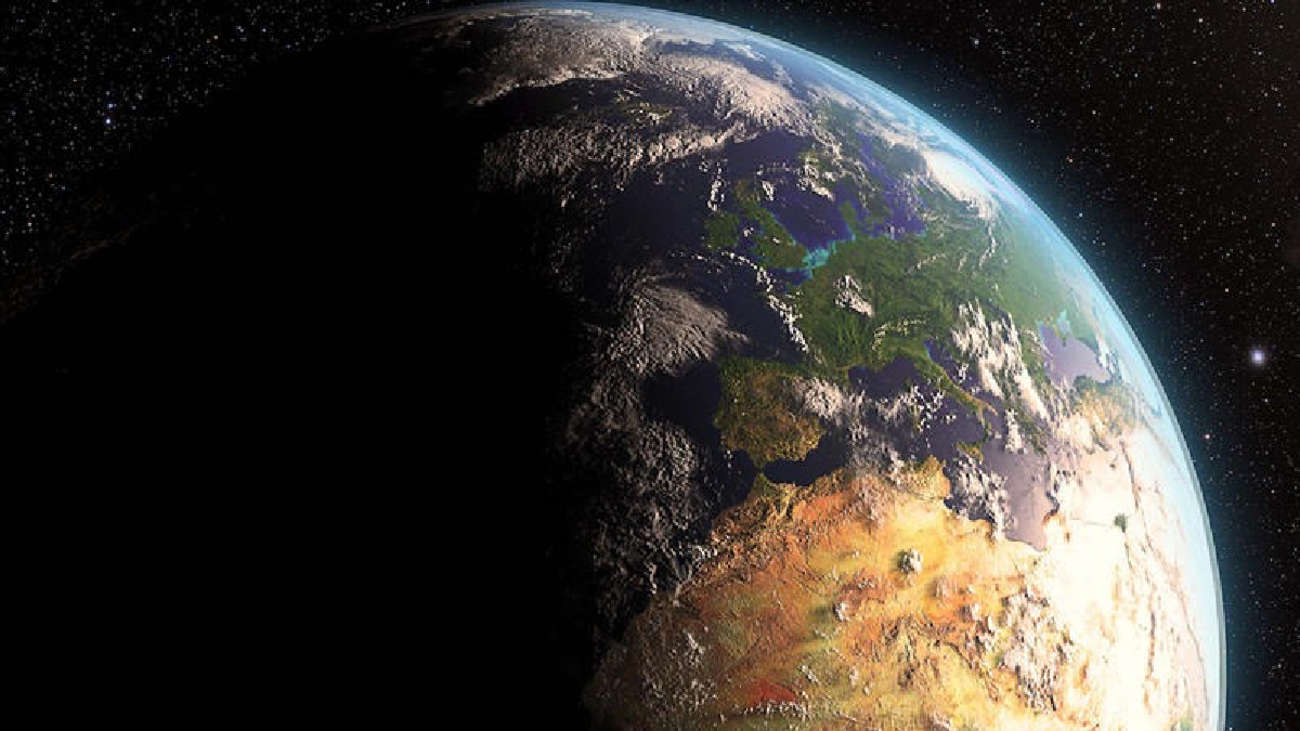
OUR PLANET IS BURNING: NASA shows Earth`s alarming climate change over the years
English
OUR PLANET IS BURNING: NASA shows Earth`s alarming climate change over the years 
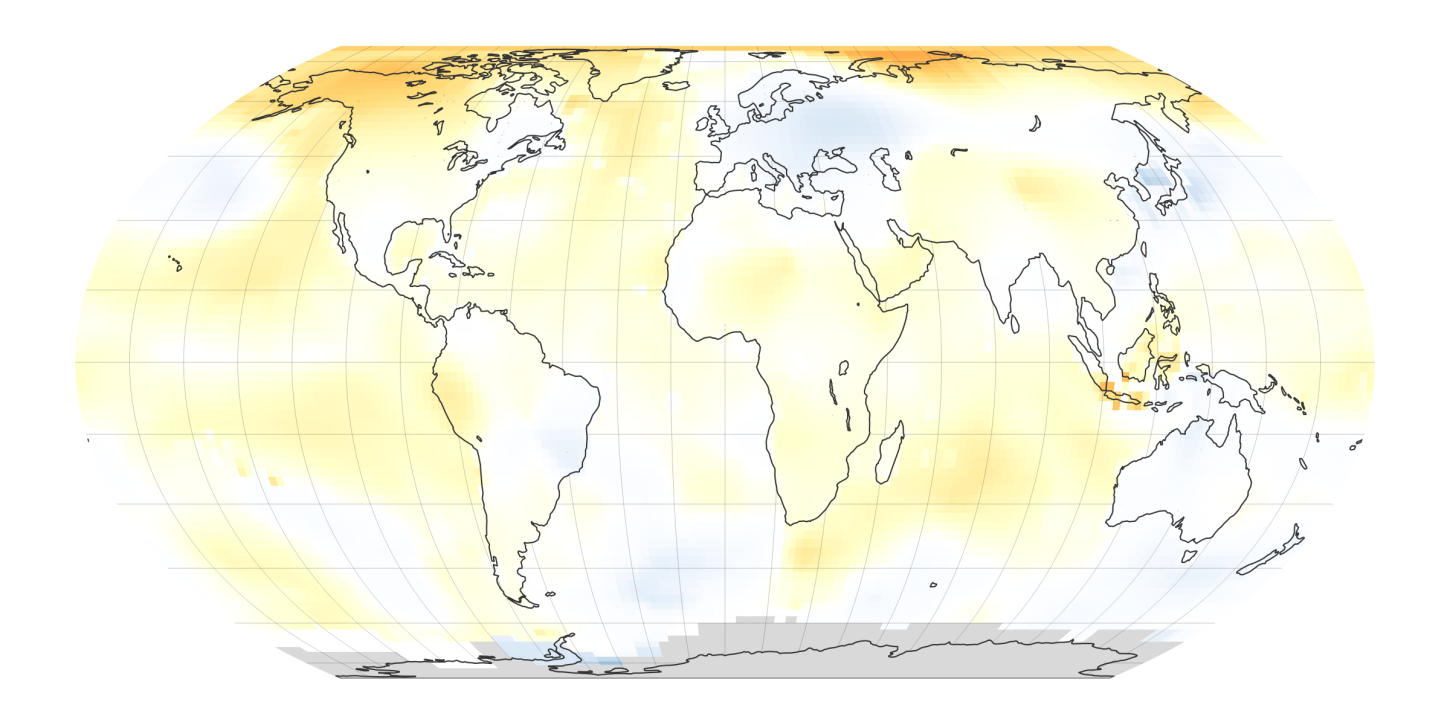
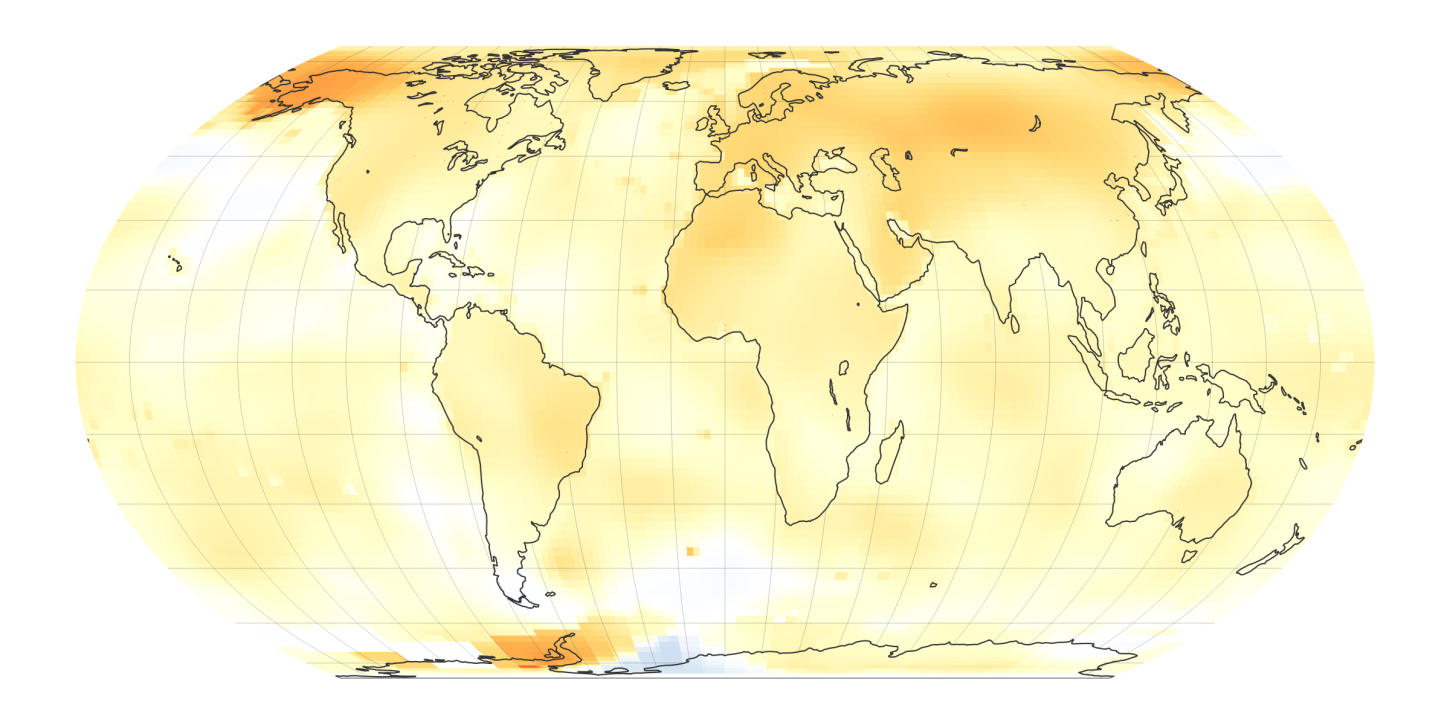
In a count that begins in 1880 and continues to the present day, the space agency produced a series of images showing the worrying increase in the Earth`s temperature and the deplorable state in which it is found. The bluish tones represent a decrease in temperature while the orange ones represent an increase of up to 4 ° Celsius.
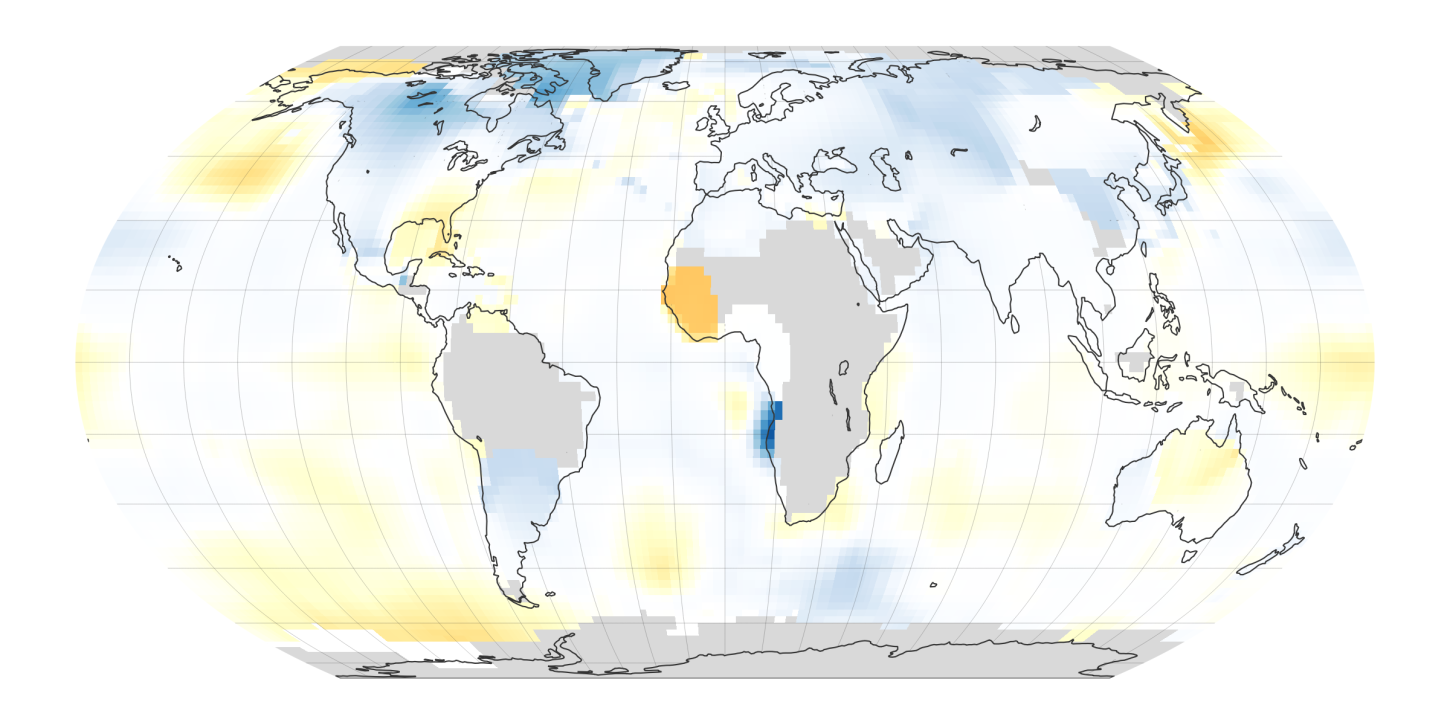
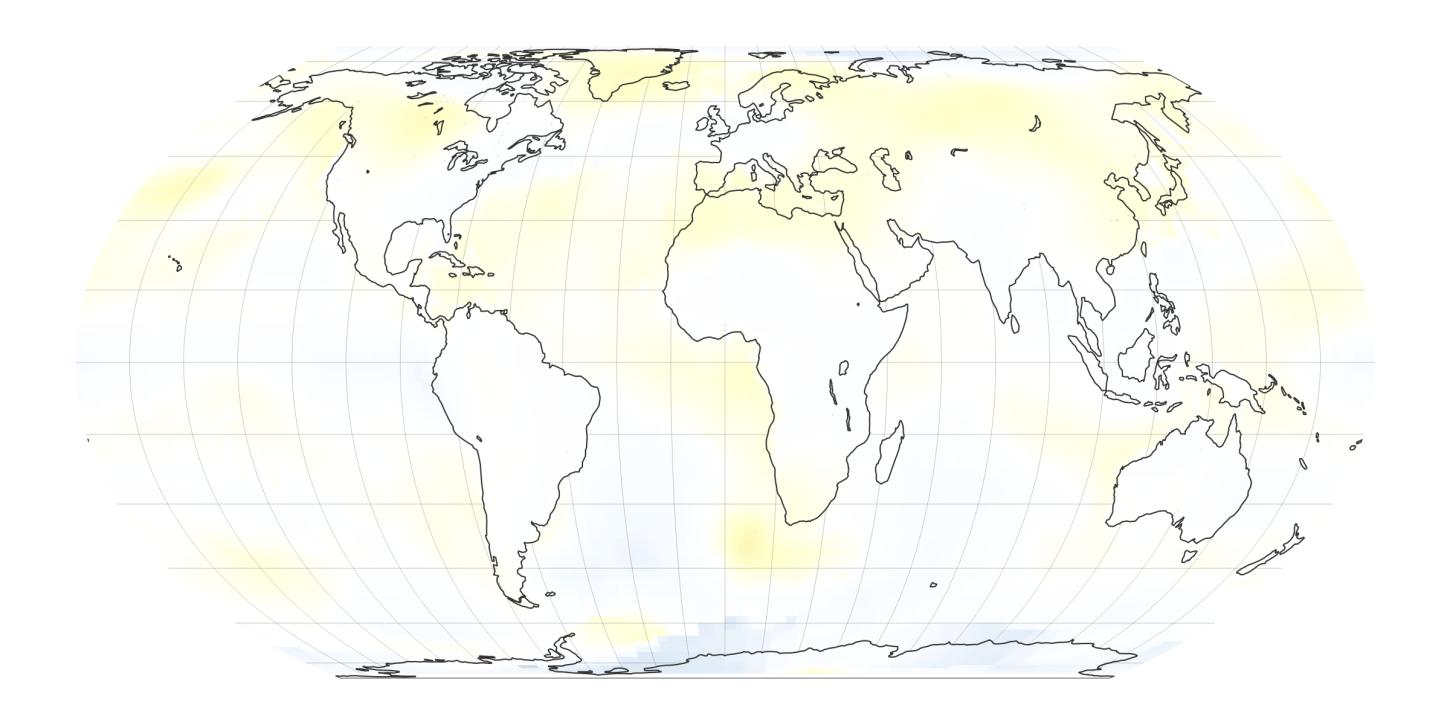
1880-1884: The beginning of the show. In this period, the planet showed places that could be considered as cold while the temperature increases were registered in the sea with the exception of Africa.
1900-1904: At the beginning of a new decade, temperature increases in regions such as America began to appear while the climate decreased in Africa. These changes were just the beginning.
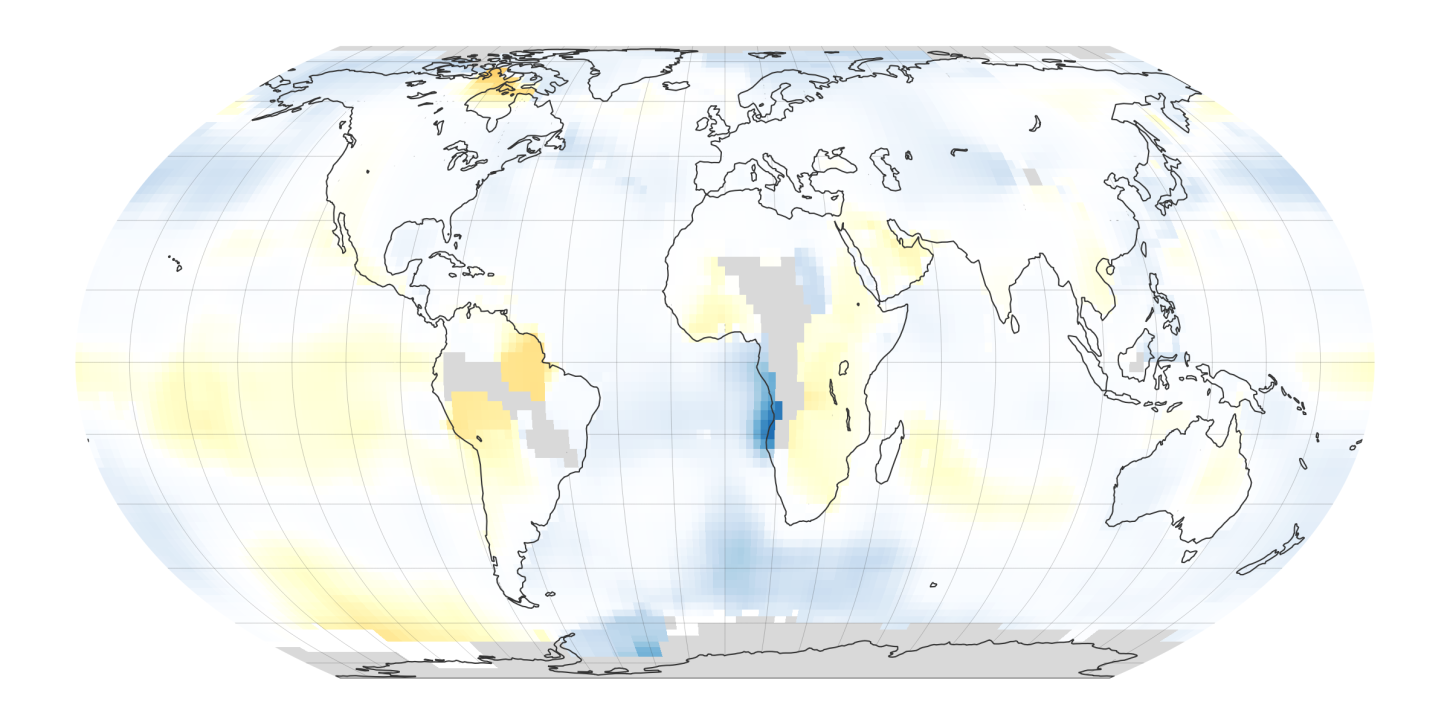
1920-1924: No significant variations were reported in addition to that seen in North Asia, where an increase of between 1 to 2 ° Celsius was recorded.
1940-1944: The most obvious change begins. In various parts of the world the average temperature is beginning to rise but where it is most noticeable is in North America and North Asia, where an increase of 2 to 3 ° Celsius is evident.
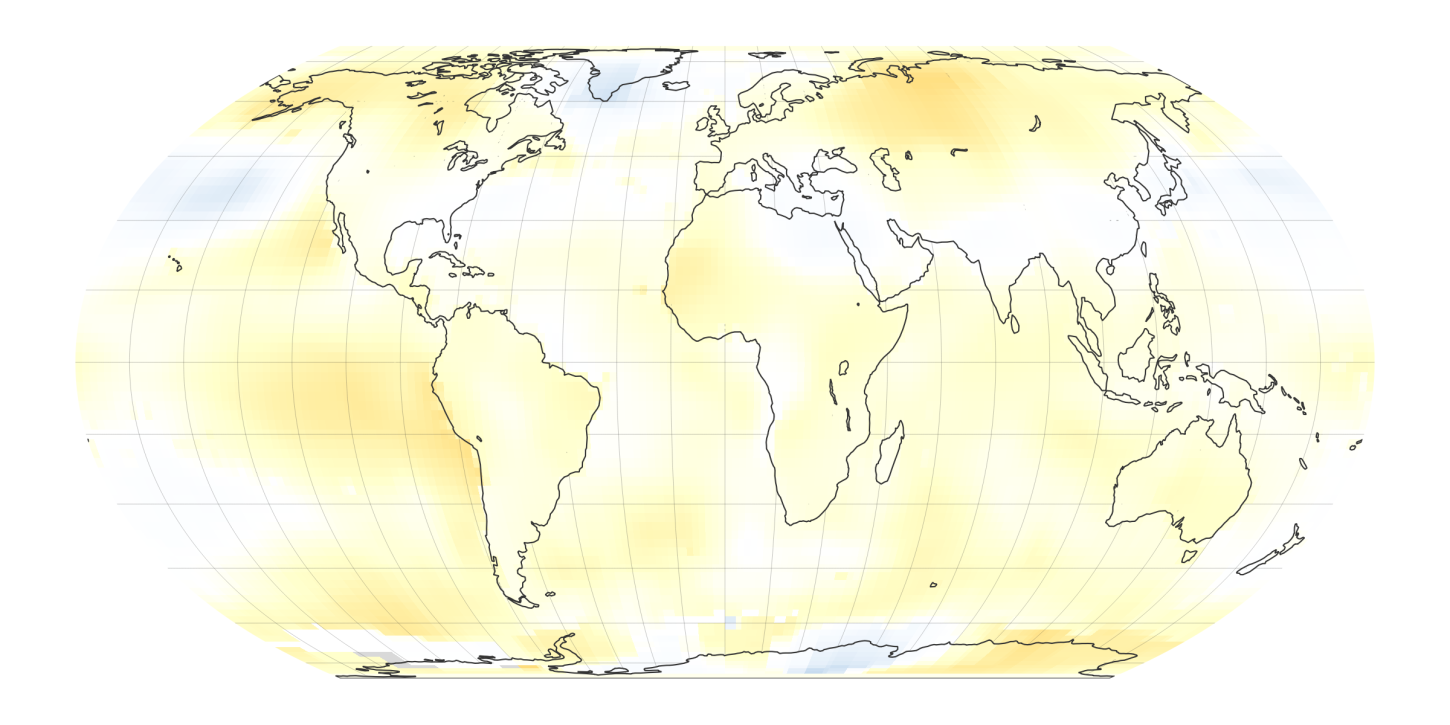
1960-1964: Incredible as it may seem, the increase was not so drastic in the next 20 years. On some continents, the temperature rose by 1 ° Celsius but the alarming signs recorded in the previous period were not shown.
1980-1984: With the arrival of the 1980s, the brief period of peace was interrupted by the expansion of the heat wave that hit several maritime areas and, again, North America and Asia.
1990-1994: In the 1990s, it became apparent that climate change had reached a critical point from which it was unthinkable to return. The increase in temperature was recorded throughout the globe and has not decreased since then.
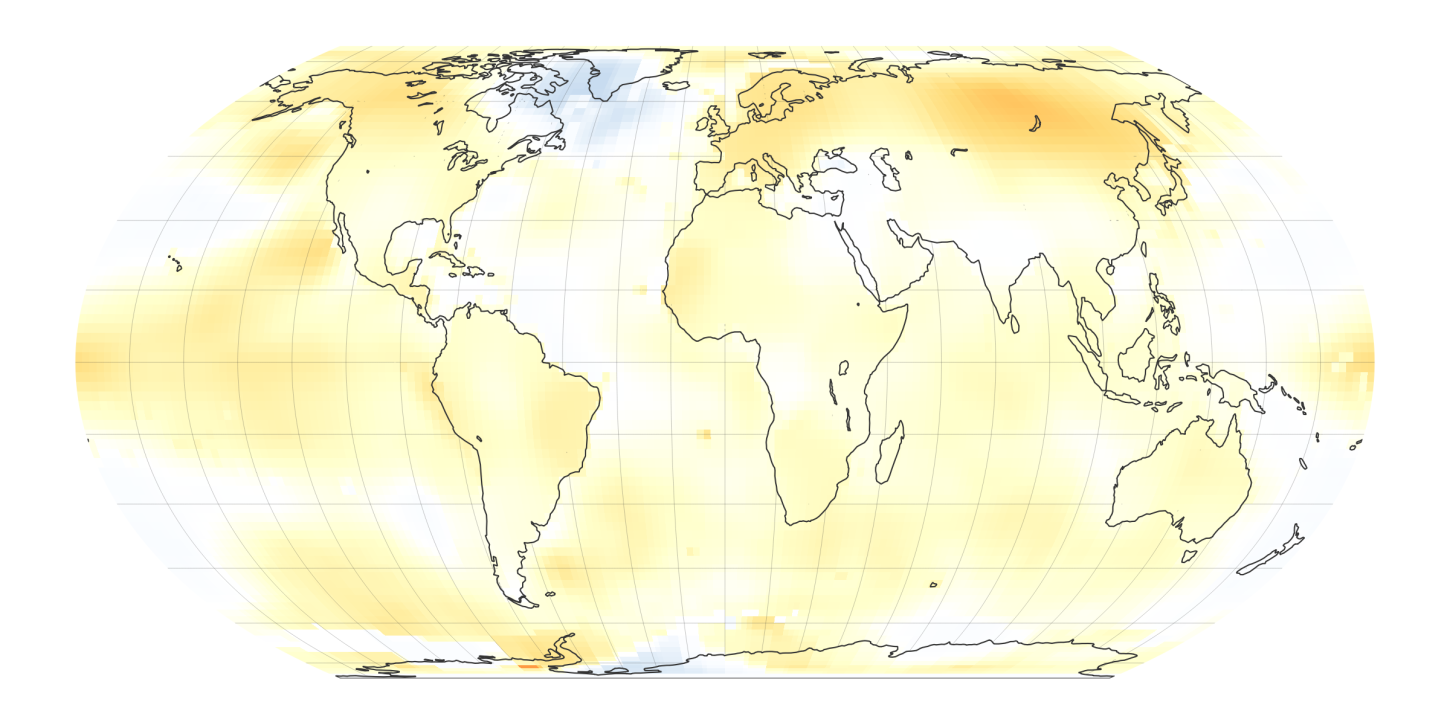
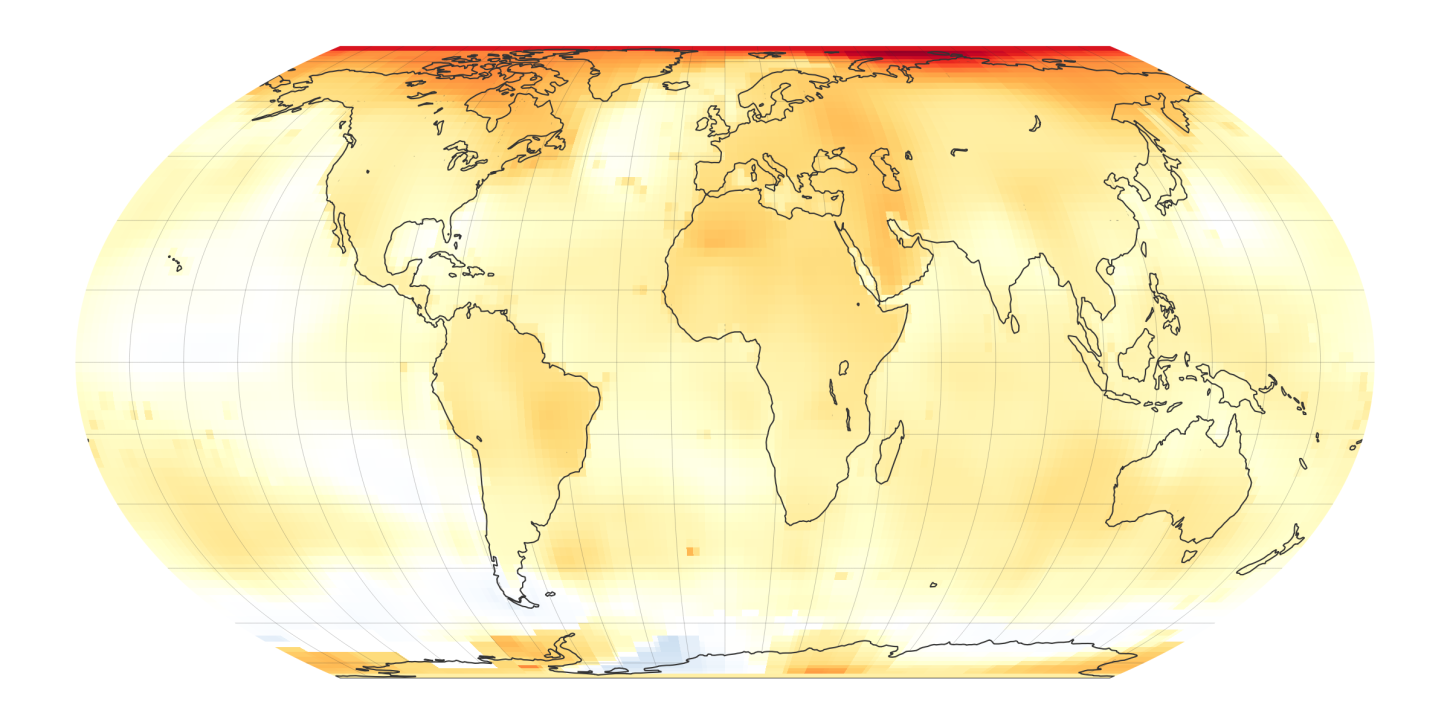
2000-2004: At the beginning of the new millennium, the planet plunged into an uncontrollable increase in temperature and because it also occurred in the icy Antarctica, the ice sheets began to melt at a rapid pace, causing an increase in the level from sea.
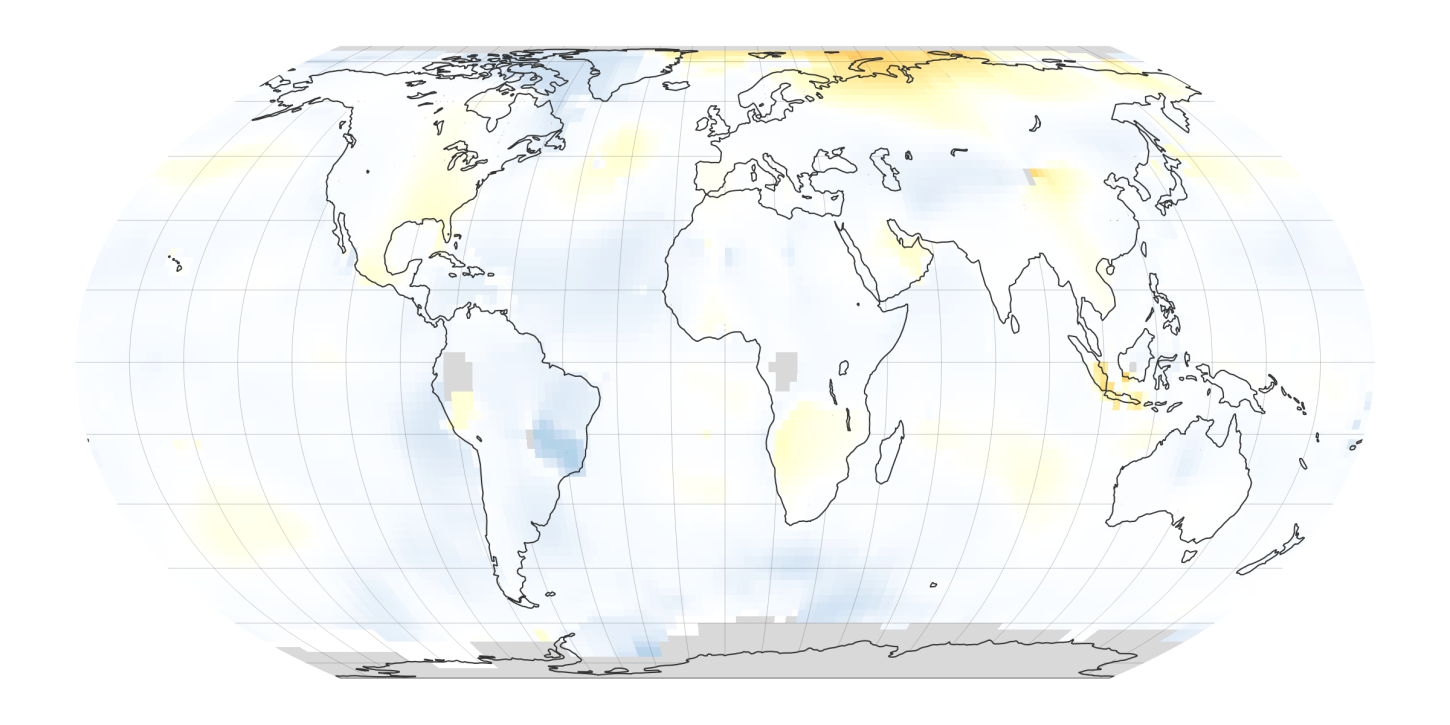
2010-2014: The red color that can be seen in the north of the map is equivalent to an increase of more than 4 ° Celsius, a number that not only affected the upper part of the planet but also the rest of the world that was already plunging into an average temperature rise of 2 ° Celsius.
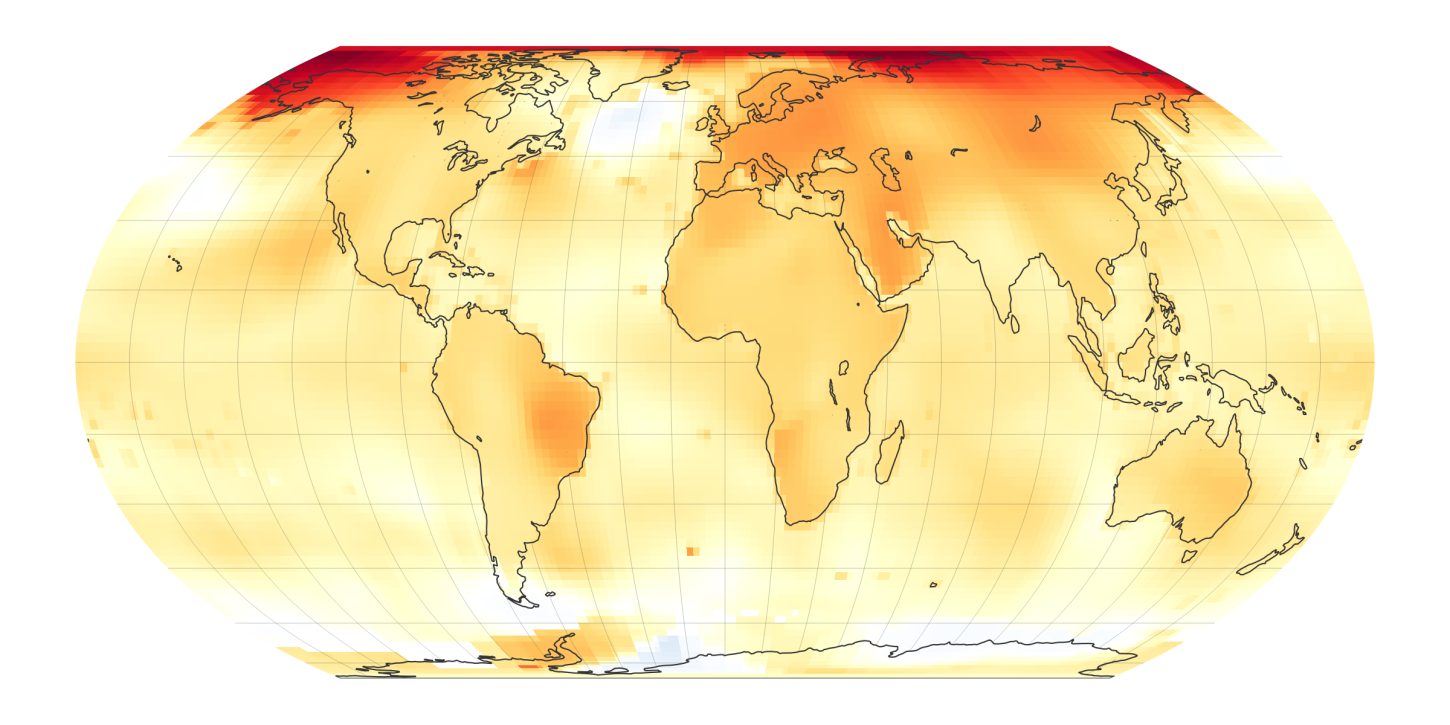
2015-2019: The most critical point was registered in the last 5 years. Our planet is burning and there are no signs that this situation will be reversed. The speed with which the temperature rises is overwhelming and the areas near the red dots on the map are the most affected.
Publication Date: 2020-01-29
Source: NASA

Ideal for small companies that need productive modules, 10 corporate emails, 5 sections, 20 product catalog, 5 SEO campaigns, e-commerce.

Ideal to start your presence on the internet, catalog of 5 products, updating documents, hosting, corporate emails and more!
Ideal for small companies that need productive modules, 10 corporate emails, 5 sections, 20 product catalog, 5 SEO campaigns, e-commerce.
Ideal to start your presence on the internet, catalog of 5 products, updating documents, hosting, corporate emails and more!


Our Staff of Content Advisors, Journalists, and Technologists are at your disposal to help you get the content you need every day.